title: "One GPU, four ways to share it: ten scenarios, and the headline finding I had to retract"
published: true
description: "I measured every GPU sharing mode across ten scenarios, published a headline finding that duplicate models are nearly free on unified memory, then failed to replicate it and retracted it. Here is what the controlled replication showed and how the original measurement fooled me."
tags: kubernetes, gpu, ai, devops
cover_image: https://llmkube.com/og-gpu-sharing-four-ways-devto.png
canonical_url: https://llmkube.com/blog/gpu-sharing-four-ways
Everyone running local models eventually has more models than GPUs. There are several answers to that, and until last week I was picking between them on intuition.
So I took two DGX Sparks and ran ten scenarios across every sharing mechanism LLMKube supports.
I also got the headline finding wrong, published it, failed to replicate it, and retracted it. That part is in here too, because how a measurement fools you is more useful than the measurement.
The four options
| Option | Layer | What it does |
|---|---|---|
exclusive |
scheduler | One model owns the card. The default. |
shared |
scheduler | Several pods co-resident via NVIDIA time-slicing. |
| ModelPool | operator | Members take turns; a swap replaces the pod. |
llamacpp-router |
runtime | One server swaps models in process. |
There's a fifth, partitioned (MIG), which I couldn't test. I'll be honest about that at the end.
Baseline
A 27B dense model at Q4 on one GB10, nothing else running: 768.85 tok/s prefill, 31.34 tok/s decode.
One lesson before any sharing. My first baseline read 12.11 tok/s decode, 2.6x too slow, because I cloned an InferenceService spec and dropped speculativeDecoding. MTP is a first-class CRD field, not an extraArgs entry, so copying the args carried none of it.
If you benchmark by cloning specs, diff the whole spec.
Time-slicing: free until it isn't
Two models co-resident, second one idle. I checked this properly by suspending the co-tenant and re-measuring rather than assuming:
| 12B model | Prefill | Decode |
|---|---|---|
| 27B co-resident, idle | 77.9-80.9 tok/s | 24.1-26.2 tok/s |
| Alone on the GPU | 76.7-77.6 tok/s | 27.3 tok/s |
Identical within noise. A model you aren't using costs you nothing but memory.
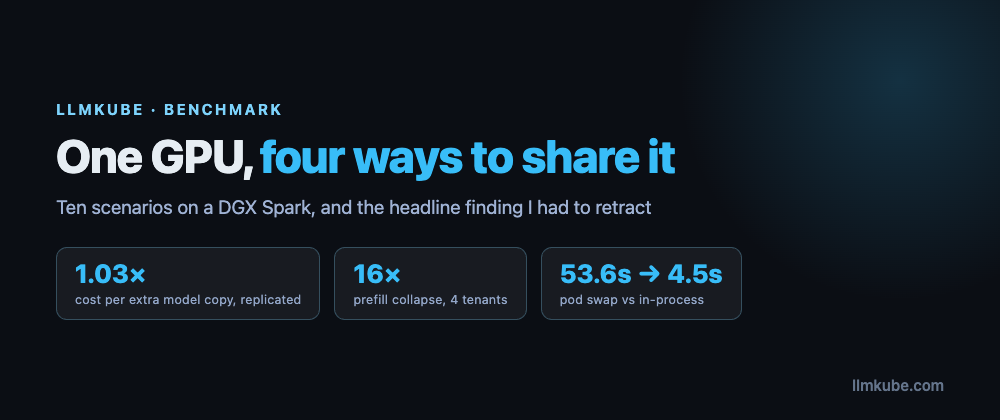
Under real concurrency it changes, and it changes asymmetrically. Four tenants all active: decode fell 4.3x to 7.33 tok/s, roughly what splitting a card four ways should cost. Prefill collapsed 16x. A 10,050-token prompt took 209 seconds.
That asymmetry is the practical finding. Decode degrades gracefully, prefill falls off a cliff. Time-slicing suits chat-shaped traffic with short prompts far better than anything reading large contexts. An agent that stuffs a repo into its window is the worst possible co-tenant.
The finding I retracted
Here is the number I led with, and why it was wrong. I am leaving the whole thing in, because how a measurement misleads you is more useful than the measurement.
I deliberately over-subscribed, three copies of the same 27B on one card, expecting to document a failure mode. It never broke. Node memory went 29.7 GiB to 33.5 GiB when the third instance loaded: about 4 GiB for a 27B model, not 17.
The obvious explanation is that llama.cpp mmaps weights, so the page cache holds one copy of the file and the kernel shares it across processes. On GB10 there is no separate VRAM, so those would be the same physical pages the GPU reads. Duplicate models nearly free on unified memory, expensive on a discrete card. A genuinely interesting claim about hardware.
It is also not true.
Before promoting it further I ran the controlled replication. Same node, same cached 15.66 GiB GGUF, three instances with --n-gpu-layers 99, nothing else running:
| Instance | Consumed |
|---|---|
| 1 | 16,727 MiB |
| 2 | 16,433 MiB |
| 3 | 16,444 MiB |
About 1.03x model size each, perfectly linear. The third instance costs 16.1 GiB, not 4. The original observation does not reproduce.
What is actually going on
The variable was never the memory architecture. It is whether the weights are offloaded.
| Arm | Cost per extra instance | Shared? |
|---|---|---|
GB10, 27B, --n-gpu-layers 99 |
1.03x model | No |
GB10, 3B, --n-gpu-layers 99 |
1.38x model | No |
RTX 5060 Ti, 3B, --n-gpu-layers 99 |
1.16x model | No |
GB10, 3B, --n-gpu-layers 0 |
0.19-0.36x model | Yes |
mmap page-cache sharing is real, and it only helps while the weights stay CPU-resident. Once llama.cpp offloads it allocates private CUDA device buffers and copies the weights into them. That happens on unified memory too. The page cache still holds one copy of the file; it just isn't what the GPU reads from.
I verified the offload rather than assuming it, same box, warm: 99.00 tok/s decode with --n-gpu-layers 99 against 11.36 tok/s with 0. The GPU arm was genuinely using the GPU, and it still paid full price per copy.
How the original measurement fooled me
Three things, and they compounded.
Two different instruments. The GB10 figure was node memory during a noisy four-tenant run. The discrete figure was nvidia-smi. I compared them as though they measured the same thing. They don't, and worse, nvidia-smi reports [N/A] for memory on GB10 because there is no separate pool to report. The instrument I trusted on one machine doesn't exist on the other.
One observation, no replication. A single reading taken while four tenants competed, treated as a finding. Every other number in this post came from a repeated, isolated measurement. That one didn't, and it's the one that was wrong.
Mismatched model sizes. A 3B on the discrete card against a 27B on the Spark. The fixed CUDA context cost is proportionally much larger on a small model, which is exactly why the 3B reads 1.38x and the 27B 1.03x. That gap is an artifact of model size, and I'd attributed it to memory architecture.
The uncomfortable part is that the wrong version was the better story. Clean mechanism, counterintuitive result, practical advice that reversed on your hardware. Everything except being true.
What survives
The Spark's co-tenancy advantage is real. It's just capacity, not economics. 128 GB of unified memory holds roughly seven 16.8 GB models where a 16 GB card holds none. Every copy costs full price on both. There are simply far more places to put one.
So the sizing rule is duller than the one I published: count models against your memory pool at roughly full model size each, whatever the architecture. What unified memory buys you is the size of the pool.
ModelPool: correct, and slow enough to plan around
One member resident at a time, swapped on demand. It behaves well: drain-before-unload preserved a full 1200-token generation while a swap was requested mid-flight, anti-thrash coalescing turned two concurrent requests into one swap, and the fail-closed path kept the incumbent resident when the successor couldn't be reached.
The cost is the swap: 122.0s cold, 53.6s warm. Pod teardown, scheduling, container start, model load.
Fine if switches are rare relative to serving. Painful if your workload alternates.
llamacpp-router: the fastest swap you can't use yet
Swapping inside one server avoids all of that. An in-process switch is 4.5 to 4.7 seconds against ModelPool's 53.6s on identical hardware. Roughly 11x cheaper.
I nearly published that as a recommendation. Then I put a real agent through the endpoint:
| Same model, same node | Prefill | Decode |
|---|---|---|
llamacpp-router |
34.07 tok/s | 3.46 tok/s |
llamacpp exclusive |
768.85 tok/s | 31.34 tok/s |
22x slower prefill, while holding a GPU the whole time.
Router mode deliberately emits no --n-gpu-layers, because different models may want different offload settings, so llama.cpp defaults to zero GPU layers. Passing the flag via extraArgs doesn't help either: router mode spawns a child server per model and the parent's flags never reach them.
You can request a GPU, have it scheduled and consumed, and serve at a twentieth of the speed with only a line in the operator log to tell you. Tracked in issue 516.
So which should you use
| If | Use | Because |
|---|---|---|
| One model | exclusive |
The default is right more often than people expect. |
| Genuinely concurrent demand, memory allows | shared |
The only mode serving two models at once. Watch prefill. |
| Roles alternate, one at a time | ModelPool | Members stay independent; budget 53.6s per switch. |
| Short prompts, many models | shared |
Decode degrades 4.3x, prefill 16x. Prompt length decides. |
And the sizing rule: count models against your memory pool at roughly full model size each, on either architecture. Unified memory buys you a bigger pool, not cheaper copies.
Three traps that produced wrong answers first
All three gave me confident, plausible, wrong numbers.
The first request after load isn't representative. On GB10 a cold request measured 93 tok/s prefill where the warm figure was 743. An 8x difference from JIT alone.
Prefix caching will happily benchmark nothing. Reusing the same prompt for warm-up and measurement produced prompt eval time = 148 ms / 4 tokens. It wasn't fast, it was skipping the work.
kubectl scale on an operator-owned Deployment does nothing. The controller reconciles the replica count straight back. My first two attempts at the idle-co-tenant comparison silently measured the same condition twice and "proved" the arms were identical for entirely the wrong reason.
What benchmarking found that benchmarks usually don't
The last scenario put a real coder-and-reviewer agent pipeline on one shared GPU instead of a synthetic load generator. It reported success end to end. It was also wrong in three ways nothing in the pipeline could see.
The coder wrote a correct two-line fix and pushed it to a completely different repository than the one it was working on, then reported success.
The reviewer approved a change it had never seen. Its branch was force-reset to the base commit before it ran, so it reviewed an empty diff and returned a confident, well-written verdict describing an unrelated commit's contents.
And an agent searching for stats matched inside a vendored minified bundle where the whole file is one line. The grep tool capped how many matches it returned but never how long one was, so a single result came back at 649,467 bytes marked "truncated": false. That one tool call blew the transcript past the stuck-loop detector's limit and the run was killed as a loop. The detector was right. The tool had lied to it.
The reviewer one bothers me most. Reviewers approving things they shouldn't had been read as a model-quality problem. It was substantially a harness problem: the models were being handed the base branch. After the fix the reviewer reads the real diff and finishes in 100 seconds instead of 304, because it's no longer wandering a repo hunting for a change that isn't there.
A synthetic benchmark exercises the paths you thought to write down. A real workload exercises the ones you didn't, and defects live exactly where the measurement wasn't looking.
Worth adding: fixing the harness didn't make the reviewer good. Given the real diff, a 12B model called a behaviour fix "improving readability without altering functionality", which is backwards. The approval was right by accident. Harness quality and model quality are separate problems, and I'd been conflating them.
What I didn't test
partitioned, which is MIG. No GPU I have is MIG-capable, both GB10s and both RTX cards report nvidia.com/mig.capable=false. So of the three gpuSharing.mode values the CRD accepts, this covers two, plus ModelPool and the router at other layers.
If you have A100s or H100s, the mode I couldn't measure is very likely the one you should be looking at, and I'd genuinely like to see those numbers.
I also measured throughput and memory, not accuracy. Nothing here says whether sharing a card changes what a model produces. It shouldn't, and I didn't verify it.
The short version
Start with exclusive. Reach for shared when demand is genuinely concurrent and prompts are short. Reach for ModelPool when roles alternate and you can absorb a minute per switch. Skip the router until it can reach the GPU.
And treat every over-subscription number as costing full model size per copy, because that is what replication showed once I stopped trusting a single reading taken under load.
LLMKube is Apache 2.0. The sharing modes live in the InferenceService CRD under spec.resources.gpuSharing. If you run this on hardware I don't have, I'd like to hear what you get.
🔗 Nguồn bài viết gốc: Christopher Maher